

In Canada, police dismiss 1 out of every 5 sexual-assault reports as unfounded – meaning police believe the crime didn't happen
When Canadian police officers complete an investigation, they give it a closure code to show the outcome. One of those codes is “unfounded.” “Unfounded” indicates the investigating officer does not believe a crime was attempted or occurred. Once an allegation is categorized that way, it effectively disappears from public record. Considered baseless, the case isn’t reported to Statistics Canada, which has implications for police and victim-services funding.
The Globe sent nearly 250 freedom of information requests to 178 police services to obtain confidential unfounded data from 1,119 police jurisdictions across the country. We received responses from 873 jurisdictions, which represent 92 per cent of the Canadian population.
Our investigation has shown that sexual-assault cases are nearly twice as likely as physical assault to be designated unfounded. (The Globe found that only 11 per cent of physical assaults were coded as unfounded.) The number is also significantly higher than the false-reporting rate, which studies have shown to be somewhere between 2 and 8 per cent.
And while, on average, 1 in 5 sexual-assault allegations is deemed unfounded, The Globe found that the statistics varied wildly from town to town, city to city and province to province. Even separate police services located in the same geographic area recorded starkly different unfounded rates. In total, police in 115 communities dismissed at least one-third of sex-assault complaints as unfounded.
Experts say these high figures and large variations are evidence of a broken system.
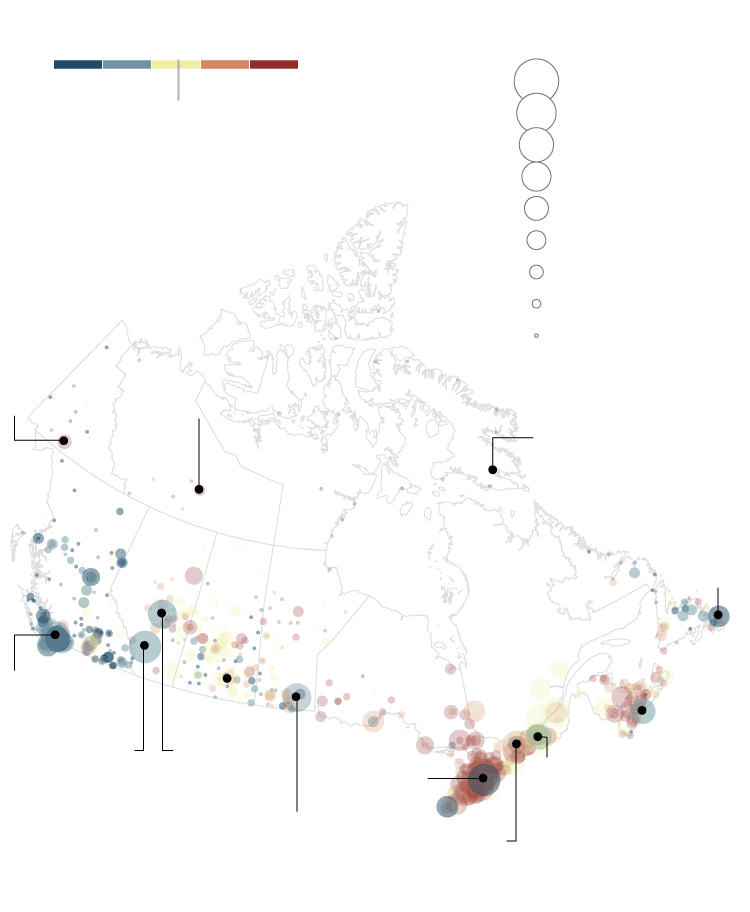
A national snapshot

Population Groups
Unfounded Sexual-Assault Rate
1,000,000+
-10
-5
+5
+10
500,000-999,999
National Rate
19%
250,000-499,999
100,000-249,999
50,000-99,999
30,000-49,999
10,000-29,999
5,000-9,999
5-4,999
Whitehorse
29%
Yellowknife
36%
Iqaluit
37%
St. John’s
8%
Vancouver
13%
Halifax
13%
Calgary
10%
Edmonton
10%
Toronto
7%
Montréal
18%
Winnipeg
2%
Ottawa
28%

Unfounded Sexual-Assault Rate
-10
-5
+5
+10
National Rate
19%
Population Groups
1,000,000+
500,000-999,999
250,000-499,999
Whitehorse
29%
Yellowknife
36%
Iqaluit
37%
100,000-249,999
50,000-99,999
30,000-49,999
10,000-29,999
5,000-9,999
5-4,999
St. John’s
8%
Vancouver
13%
Halifax
13%
Calgary
10%
Winnipeg
2%
Edmonton
10%
Montréal
18%
Saint John
51%
Toronto
7%
Ottawa
28%

Population Groups
1,000,000+
500,000-999,999
250,000-499,999
100,000-249,999
50,000-99,999
30,000-49,999
Whitehorse
29%
Yellowknife
36%
Iqaluit
37%
10,000-29,999
5,000-9,999
5-4,999
Unfounded Sexual-Assault Rate
-10
-5
+5
+10
National Rate
19%
St. John’s
8%
Vancouver
13%
Charlottetown
29%
Calgary
10%
Winnipeg
2%
Edmonton
10%
Montréal
18%
Halifax
12%
Toronto
7%
Ottawa
18%
In general, larger cities tended to have lower unfounded rates. Winnipeg (2%), Toronto (7%), Edmonton (10%), Calgary (10%), Vancouver (13%) and Montréal (18%) were below the national rate. In addition, western police services, particularly British Columbia, tended to have lower unfounded statistics.

Very low rates

Low rates

High rates

Very high rates


Population Groups
Unfounded Sexual-Assault Rate
1,000,000+
-10
-5
+5
+10
500,000-999,999
250,000-499,999
National Rate
19%
100,000-249,999
50,000-99,999
30,000-49,999
10,000-29,999
5,000-9,999
5-4,999
Vancouver

Population Groups
Unfounded Sexual-Assault Rate
1,000,000+
-10
-5
+5
+10
500,000-999,999
National Rate
19%
250,000-499,999
100,000-249,999
50,000-99,999
30,000-49,999
10,000-29,999
5,000-9,999
5-4,999
Vancouver

Population Groups
Unfounded Sexual-Assault Rate
1,000,000+
-10
-5
+5
+10
500,000-999,999
National Rate
19%
250,000-499,999
100,000-249,999
50,000-99,999
30,000-49,999
10,000-29,999
5,000-9,999
5-4,999
Vancouver

Population Groups
Unfounded Sexual-Assault Rate
1,000,000+
-10
-5
+5
+10
500,000-999,999
National Rate
19%
250,000-499,999
100,000-249,999
50,000-99,999
30,000-49,999
10,000-29,999
5,000-9,999
5-4,999
Vancouver

Population Groups
Unfounded Sexual-Assault Rate
1,000,000+
-10
-5
+5
+10
500,000-999,999
National Rate
19%
250,000-499,999
100,000-249,999
50,000-99,999
30,000-49,999
10,000-29,999
5,000-9,999
5-4,999
Vancouver
The West Coast had lower unfounded rates
One of the most obvious patterns in the unfounded data was that West Coast police services, whether they were RCMP detachments or independent municipal services, tended to have below-average rates.
There are a few unique factors at play in British Columbia. For one, the most in-depth review of police unfounded files looked at 2002-2003 files from four B.C. police services, so experts say it's possible the increased scrutiny has had an impact elsewhere. For another, B.C. is one of only a few Canadian jurisdictions where the Crown, not the police, decides whether to lay charges.
In addition, B.C. has the highest legal test to bring a case to court. The Crown needs to show a “substantial likelihood of conviction,” rather than a “reasonable likelihood” or “reasonable prospect” of conviction, which is the standard elsewhere in the country. This higher bar could mean police officers are more careful with how they treat cases, experts told The Globe.

Montreal
Sudbury
Ottawa
Toronto
Population Groups
Windsor
1,000,000+
500,000-999,999
250,000-499,999
100,000-249,999
50,000-99,999
30,000-49,999
Unfounded Sexual-Assault Rate
10,000-29,999
-10
-5
+5
+10
5,000-9,999
National Rate
19%
5-4,999

Montreal
Sudbury
Ottawa
Population Groups
1,000,000+
Toronto
500,000-999,999
250,000-499,999
Windsor
100,000-249,999
50,000-99,999
30,000-49,999
Unfounded Sexual-Assault Rate
10,000-29,999
-10
-5
+5
+10
5,000-9,999
National Rate
19%
5-4,999

Population Groups
1,000,000+
500,000-999,999
Montreal
250,000-499,999
Sudbury
Ottawa
100,000-249,999
50,000-99,999
30,000-49,999
10,000-29,999
5,000-9,999
5-4,999
Toronto
Unfounded Sexual-Assault Rate
-10
-5
+5
+10
National Rate
19%
Windsor

Montreal
Sudbury
Ottawa
Toronto
Population Groups
Windsor
1,000,000+
500,000-999,999
250,000-499,999
100,000-249,999
Unfounded Sexual-Assault Rate
50,000-99,999
30,000-49,999
-10
-5
+5
+10
10,000-29,999
National Rate
19%
5,000-9,999
5-4,999
Montreal
Sudbury
Ottawa
Population Groups
Toronto
1,000,000+
500,000-999,999
250,000-499,999
100,000-249,999
50,000-99,999
Windsor
30,000-49,999
10,000-29,999
5,000-9,999
5-4,999
Unfounded Sexual-Assault Rate
-10
-5
+5
+10
National Rate
19%
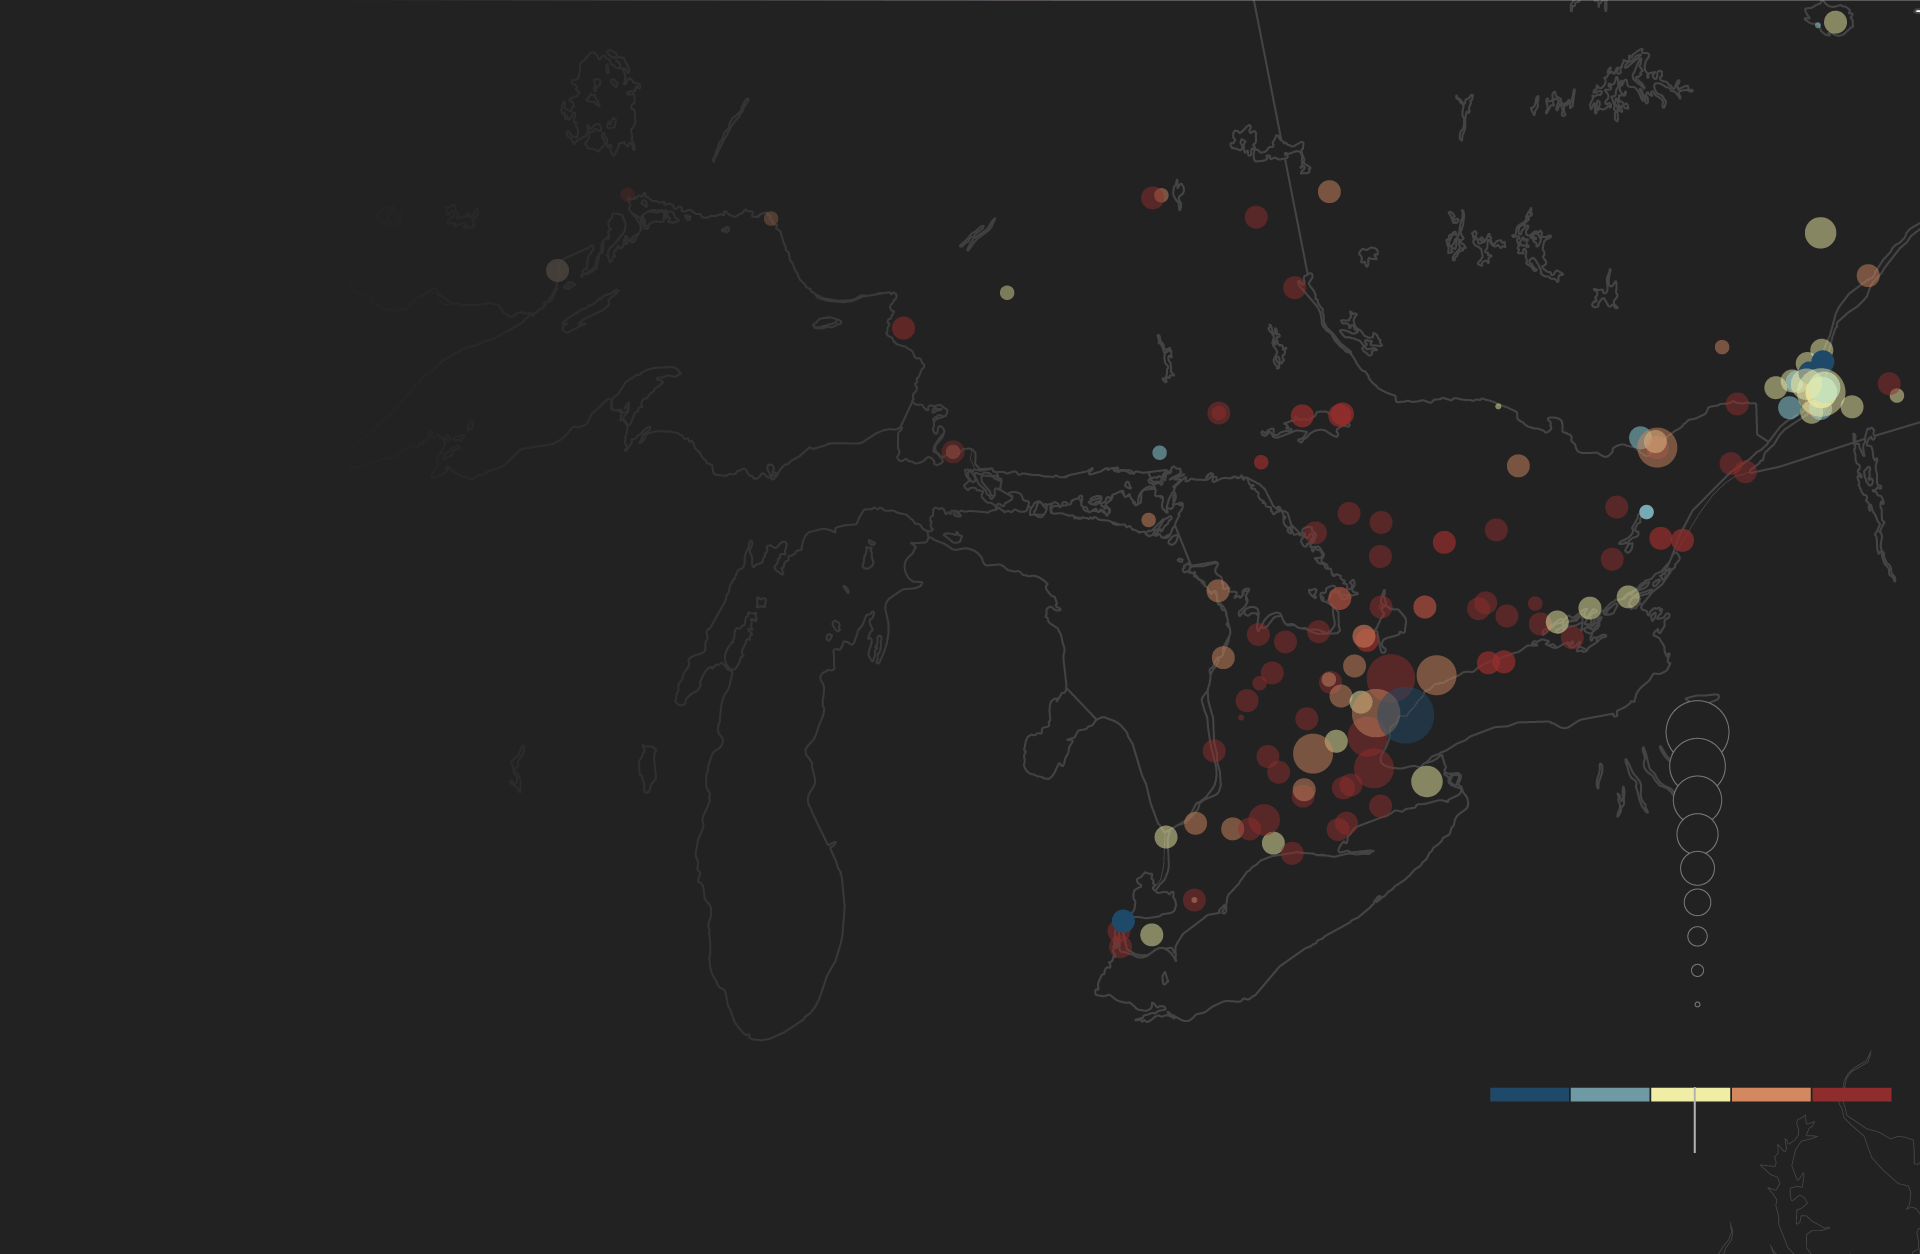
Southern Ontario had higher unfounded rates
The other clear picture to emerge from the data was that Southern and rural Ontario unfounded rates were much higher than the national rate. Many of these communities are policed by the Ontario Provincial Police. The OPP's unfounded rate was 34 per cent.
By province and territory
Although there were examples of both high and low sexual-assault unfounded rates in nearly every region of the country, on average, Canada's smallest regions – located in the North and the Maritime provinces – typically had the highest unfounded rates among the provinces and territories. Just as unfounded rates fluctuated significantly between jurisdictions, the range among Canada's provinces was equally dramatic, from 11 per cent to 32 per cent.
Police services
Just as there were wide differences between the country's provinces and territories, unfounded rates ranged significantly among Canada's police services. The Globe received data from 125 independent municipal services. Three provinces have their own provincial force, the Sûreté du Québec, The Royal Newfoundland Constabulary and the Ontario Provincial Police. In addition, the Royal Canadian Mounted Police are responsible for rural and urban communities across the country.

The correlation between more female officers and lower unfounded rates
Using 2014 data from Statistics Canada's Police Administration Survey, The Globe compared municipal police jurisdictions' 2014 sexual-assault unfounded rates with the percentage of female officers on staff. The results show a correlation between having an above-average percentage of female officers and lower-than-average unfounded numbers. The unfounded rate among communities with a higher-than-average percentage of female officers was 15 per cent.
2014 sexual-assault unfounded rate compared to rate of female officers
In B.C., 59 per cent of communities had above-average female officer rates – another possible reason B.C. posted lower overall averages.
In Ontario, 83 per cent of communities had fewer female officers than average.
The highest and lowest rates across the country
Highest Rates
- 1 Central Saanich, B.C. 60 15 of 25 allegations Policed population: 16,562
- 2 LaSalle, Ont. 59 30 of 51 allegations Policed population: 29,501
- 3 Bracebridge, Ont. 56 87 of 154 allegations Policed population: 37,022
- 4 Truro, N.S. 55 53 of 96 allegations Policed population: 12,225
- 5 Huntsville, Ont. 55 66 of 121 allegations Policed population: 23,832
Lowest Rates
- 1 Winnipeg, Man. 2 66 of 3483 allegations Policed population: 709,171
- 2 Windsor, Ont. 3 32 of 939 allegations Policed population: 218,806
- 3 Nanaimo, rural, B.C. 4 4 of 114 allegations Policed population: 14,182
- 4 Boundary/Grand Forks, B.C. 5 3 of 64 allegations Policed population: 8,546
- 5 Sidney, municipal, B.C. 5 4 of 81 allegations Policed population: 11,681
Findings by population size
Canadian communities with fewer than 100,000 residents tended to have higher-than-average unfounded rates. Beyond that, the larger the city, the lower the numbers. Experts have speculated that this could be because smaller jurisdictions have fewer resources, such as a dedicated specialized sex-assault unit, and that these areas may also have less media scrutiny.
Communities listed by national five-year unfounded rate
Percentage of sexual-assault allegations cleared as unfounded (2010-2014). The list below includes all communities that have sexual-assault unfounded data across all five years
Filter by Population
What's the unfounded rate where you live?
Curious what the unfounded rate is in your hometown? Enter your community name or police service in the field above. You'll also find information about your jurisdiction's sexual-assault charge rate and assault unfounded rate.
If you notice an error, please send an email to datafeedback@globeandmail.com